El Niño Southern Oscillation

Chances are you have heard the term “ENSO” thrown about by TV meteorologists a few times might have wondered what they were talking about. In an acronym-heavy industry, you can quickly get lost when the alphabet soup is served. ENSO is not the name of your favorite Sci-Fi movie character, but is the acronym for a naturally occurring phenomenon located along the equator in the Pacific Ocean called the El Niño-Southern Oscillation.
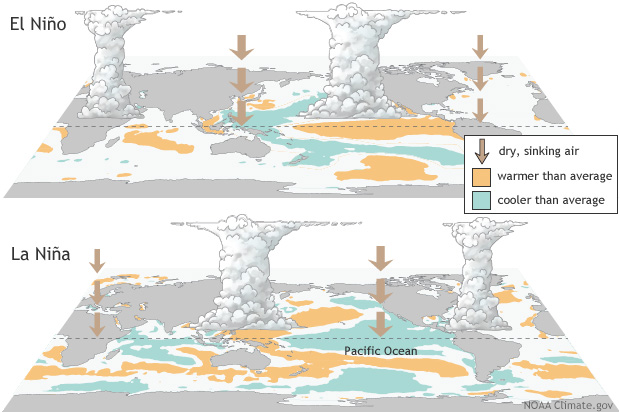
Scientists pay close attention to sea surface temperatures (SSTs) as there are three ENSO phases: ENSO neutral, El Niño, and La Niña. Each phase requires associated changes in the atmosphere to be a true ENSO event.
- ENSO Neutral - refers to normal SSTs (75-80 degrees Fahrenheit) and is generally associated with fairly normal winter weather patterns across the US. Much of the Midwest is dominated by cold temperatures, while the southern US is warm and wet. Hurricane development is normal during this phase. At times, ocean temperatures may look as if they are an El Niño or La Niña during the neutral phase, but are not coupled with changes in the atmosphere.
- El Niño - is present when SSTs are 0.5-degree Celsius warmer than normal and causes easterlies (winds from east to west) to weaken and in some cases changes to westerly wind flows along the equator. This contributes to warmer, drier conditions across the northern US, with wet weather in the southern US during the winter. Hurricane development in the Atlantic tends to be lessened, but the development in the Pacific is amplified.
- La Niña - is present when SSTs are 0.5-degree Celsius cooler than normal and the easterly winds become stronger. These patterns are associated with cold, wet winters across much of the northern US and warmer, drier conditions in the southern US. Hurricane development in the Atlantic is amplified.
Phases swing back and forth every 2-7 years on average and can vary in intensity, which impacts global circulations. El Niño occurs more frequently than La Niña, which usually lasts 9-12 months. La Niña generally lasts 1-3 years. This influences the position of the pacific jet stream, which serves as a large driver of weather across the United States.
While El Niño events have been occurring for thousands of years, they were not studied in depth until the late 20th century. Sea surface temperature data is most often used to represent when the El Niño Southern Oscillation (ENSO) is occurring. For this reason, most ENSO climatologies are based on data from 1950 to present, consistent with when sea surface temperature data are available.
ENSO Indices & Past Events
Oceanic Niño Index
Many different indices have been created to track ENSO, but one of the most commonly used index is the Oceanic Niño Index (ONI). This index is tracked and released monthly on the Climate Prediction Center's website. The ONI uses a three month mean of sea surface temperature anomalies in the Niño 3.4 Region. Events happen when ONI values meet the thresholds for a minimum of five overlapping seasons (monthly 3-month averages):
- ENSO Neutral: ONI greater than -0.5 AND less than 0.5
- El Niño: ONI greater than or equal to 0.5
- La Niña: ONI less than or equal to -0.5
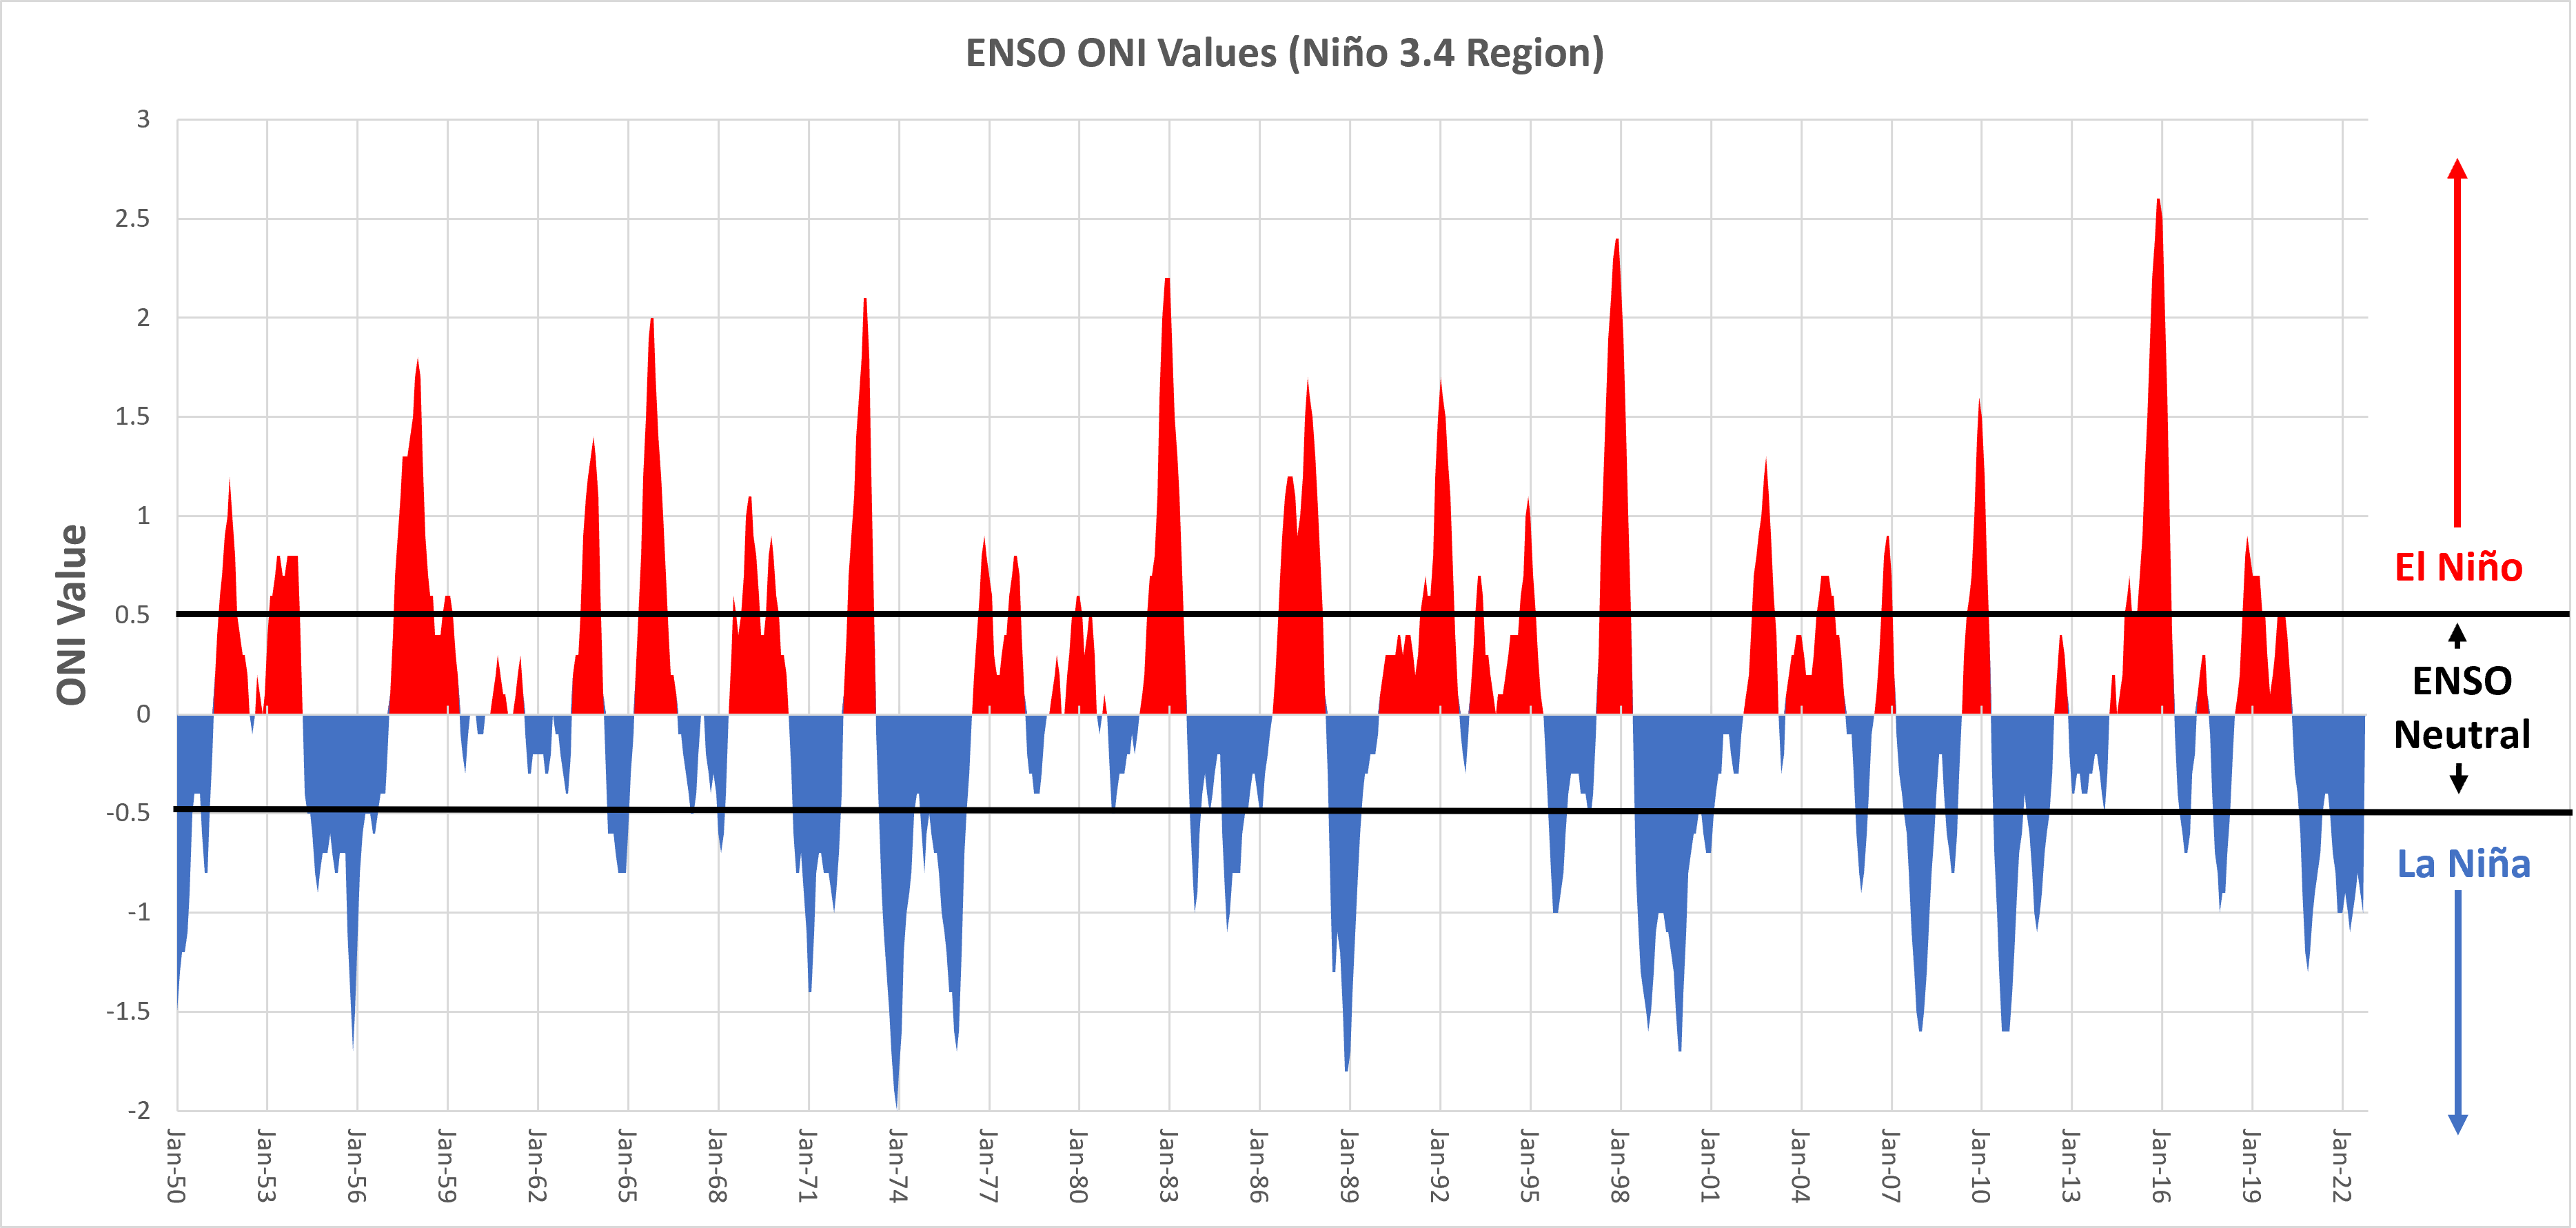
Oceanic Niño Index since 1950.
ENSO events vary not only in duration, but also strength. El Niño events are considered weak when ONI values are between 0.5-0.9, moderate from 1.0-1.4, and strong for greater than 1.5. The strongest El Niño ONI values on record since 1950 occurred in Nov-Dec 2015 (2.6), Nov-Dec 1997 (2.3), and Nov-Dec 1982 (2.2).
La Niña events are considered weak when ONI values are between -0.5 to -0.9, moderate from -1.0 to -1.4, and strong for less than -1.5. The strongest La Niña ONI values occurred in Nov-Dec 1973 (-2), January 1974 (-1.9), and Nov-Dec 1988 (-1.8).
Extended Multivariate ENSO Index
Another index that is used by the NOAA Physical Sciences Laboratory is the Extended Multivariate ENSO Index (MEI). This index was created to create a more reliable ENSO index to incorporate additional measured variables (sea-level pressure, sea surface temperature, surface winds, and outgoing longwave radiation) and was used for research purposes. Rather than three month averages, like the ONI, this index uses bi-monthly seasons (Dec-Jan, Jan-Feb, etc.). This index is released on the NOAA Physical Sciences Laboratory website.
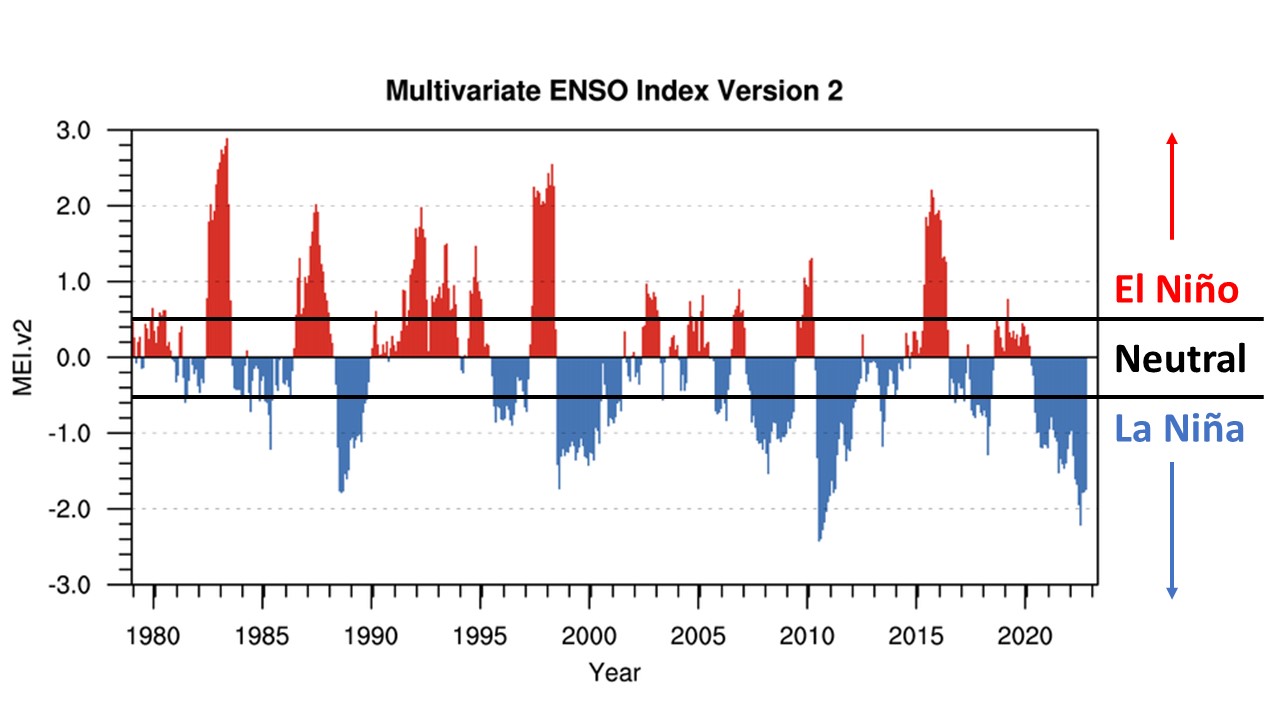
MEI since 1979. Source
Similar to the ONI, MEI ENSO events are classified by the following thresholds being met:
- ENSO Neutral: MEI greater than -0.5 AND less than 0.5
- El Niño: MEI greater than or equal to 0.5
- La Niña: MEI less than or equal to -0.5
The strongest MEI values since 1979 (not same event) recorded for El Niño events were Mar-Apr 1983 (2.9) and Mar-Apr 1998 (2.5). For La Niña events, largest MEI values were Jun-Jul and Jul-Aug 2010 (-2.4) and Jun-Jul 2022 (-2.2).
Other ENSO Indices
There are other ENSO Indices, such as the Southern Oscillation Index, which is monitored at the Climate Prediction Center.
Past ENSO Events
Based on the MEI, there have been 15 El Niño, 19 neutral, and 16 La Niña events since 1950 (table below). Ranks of the ENSO events can be seen at the NOAA Physical Sciences Laboratory website
.| El Niño | Neutral | La Niña |
|---|---|---|
| 1958 | 1952-1954 | 1950 |
| 1966 | 1957 | 1951 |
| 1973 | 1959-1961 | 1955 |
| 1978 | 1963-1965 | 1956 |
| 1980 | 1967-1970 | 1962 |
| 1983 | 1972 | 1971 |
| 1987 | 1975 | 1974 |
| 1988 | 1977 | 1976 |
| 1992 | 1979 | 1989 |
| 1995 | 1981-1982 | 1999 |
| 1998 | 1984-1986 | 2000 |
| 2003 | 1990-1991 | 2008 |
| 2007 | 1993-1994 | 2011 |
| 2010 | 1996-1997 | 2012 |
| 2016 | 2001-2002 | 2021 |
| 2004-2006 | 2022 | |
| 2009 | ||
| 2013-2015 | ||
| 2017-2020 |
ENSO Impacts
ENSO events vary in strength, thus impacts from each ENSO event can differ and predicting these effects can be difficult. Climatologies of El Niño events have been developed over the past several decades and have found that in general, warmer and slightly drier wintertime conditions occur in the Midwest during El Niño. For La Niña events, cooler and wetter wintertime conditions occur. These impacts can be seen in the images below.
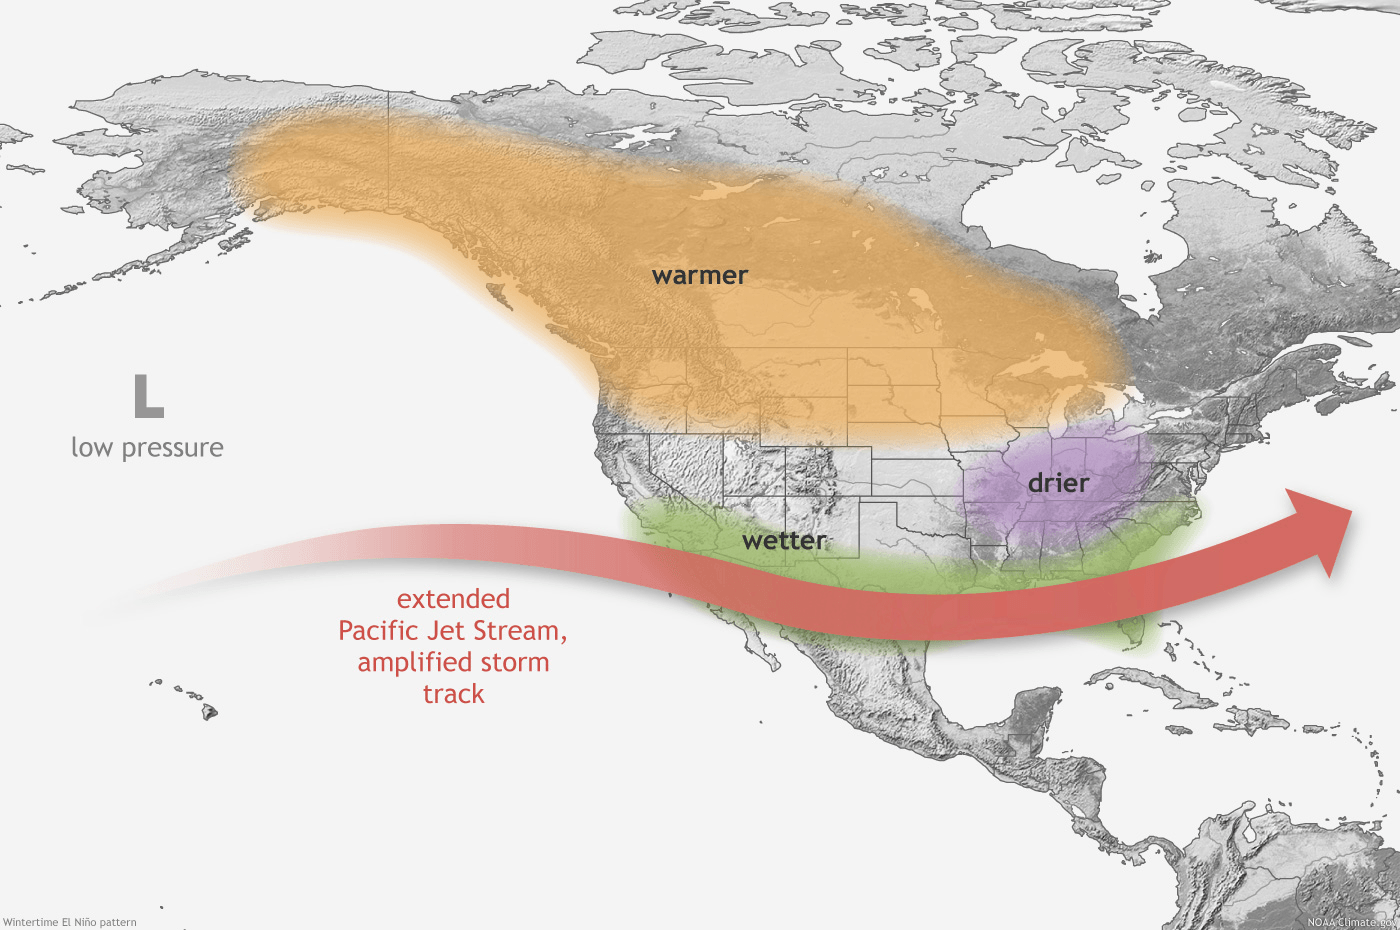
El Niño winter pattern. Source: climate.gov
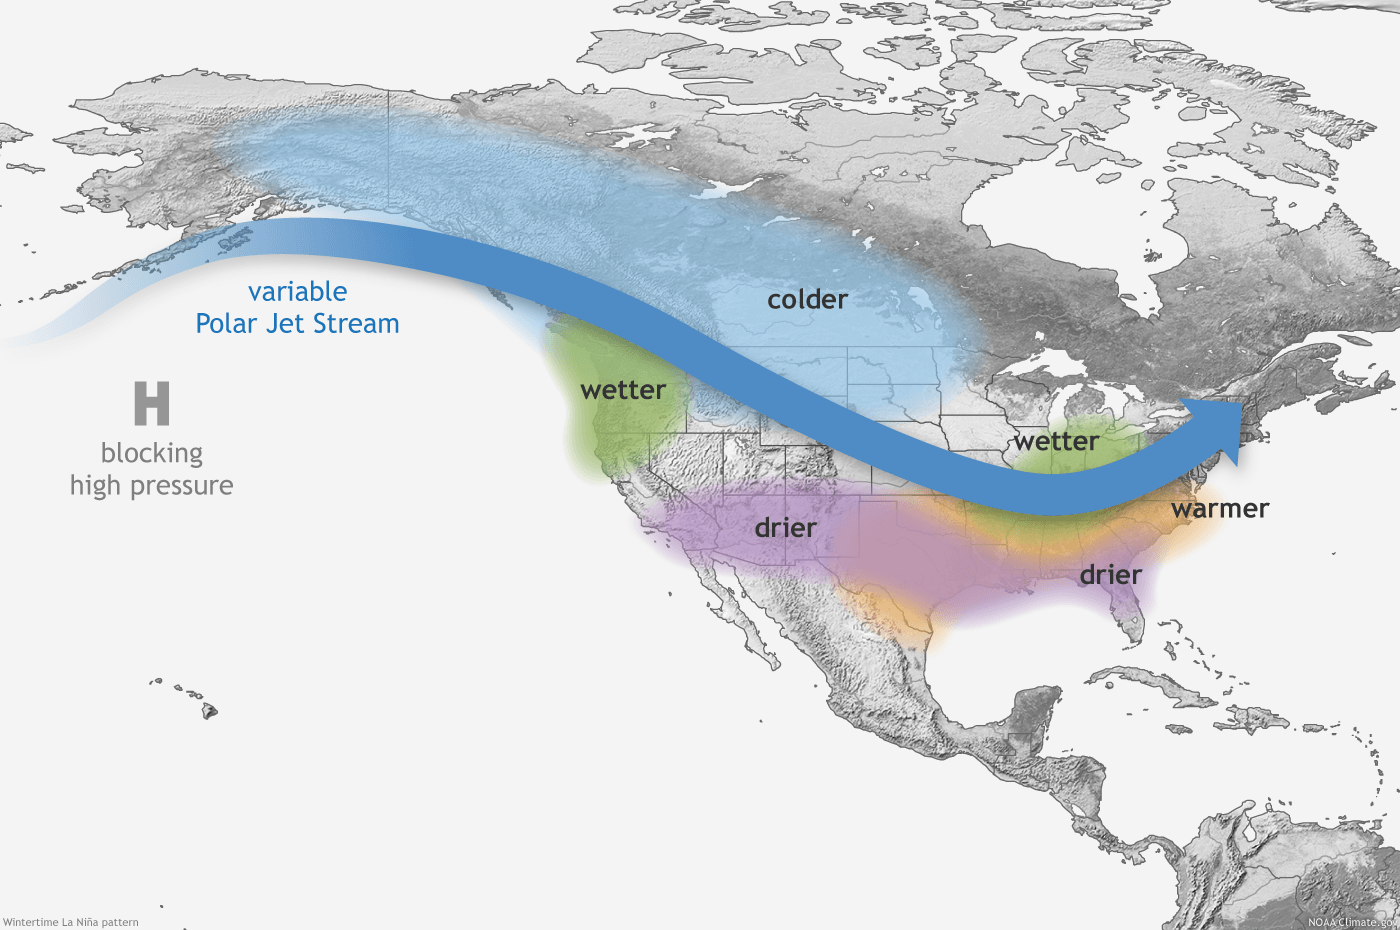
La Niña winter pattern. Source: climate.gov
During the heart of the summer (June, July, and August), ENSO events have a lesser impact on Midwest temperature and precipitation patterns. ENSO events are usually weaker during the summer months. In addition, ENSO mainly influences the location of the jet stream over North America. The jet stream is weaker and farther north during the summer months, minimizing the effects of ENSO on weather in the United States.
Monitoring ENSO
Many resources provide the current ENSO conditions. The primary resource for up-to-date ENSO conditions is the Climate Prediction Center, where they provide information about historical data, outlooks, expert discussions, and diagnostic tools. The other resources also provide their own monitoring information, but largely derive from the CPC.


ENSO Resources
For more detailed information on ENSO, the following resources are available:
ENSO Observations and Climate Data
- Climate.gov: El Niño & La Niña
- NOAA CPC: Monthly Atmospheric & SST Indices
- NOAA NCEI: Data Access
- NOAA PMEL: Global Tropical Moored Buoy Array
- NOAA PMEL: El Niño Theme Page
- NOAA CPC: Daily MJO Indices
- NASA JPL: El Niño/La Niña Watch & PDO
ENSO Discussions and Analyses
- NOAA CPC: El Niño/Southern Oscillation (ENSO) Diagnostics Discussion
- NOAA CPC: ENSO Diagnostics Discussion Archive
- NOAA CPC: El Niño/Southern Oscillation (ENSO)
- Australian BoM: Climate Driver Update
- IRI: ENSO Resources